Application Examples
To illustrate the practical use of the PSA kinetics in defining patients at high or low risk for progression, we consider 3 patients
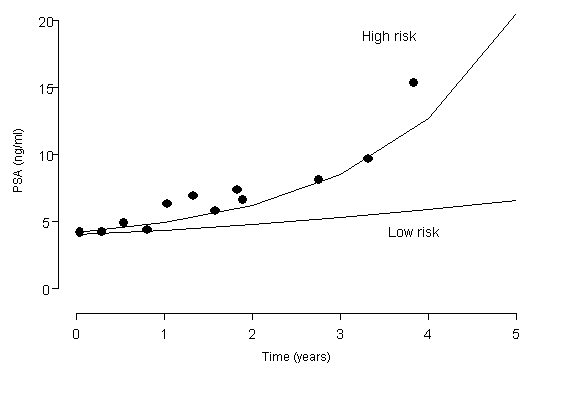
Patient I is a 67-year-old man with a baseline Gleason of 6 and a baseline PSA of 4.2 ng/ml. The corresponding predicted quadratic curves of high and low risk are plotted in the following graph with observed PSA values. For the 3.8-year period the PSA levels have been rising with a calculated PSA DT of 2.6 years. About 75% of the observed points lie above the 'high risk' line. Definitive therapy should be strongly recommended for him.

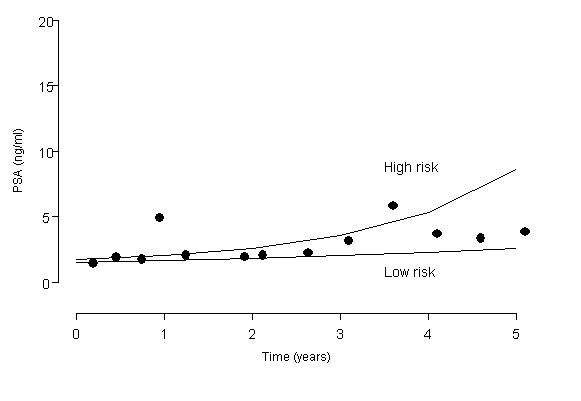
Patient II is a 69-year-old man with a baseline Gleason of 5 and a baseline PSA of 1.8 ng/ml. In the graph for the 5.1-year period the PSA levels have been fluctuating between 'high risk' and 'low risk' lines with a calculated PSA DT of 3.6 years. It would be reasonable that this patient should have ongoing close monitoring.

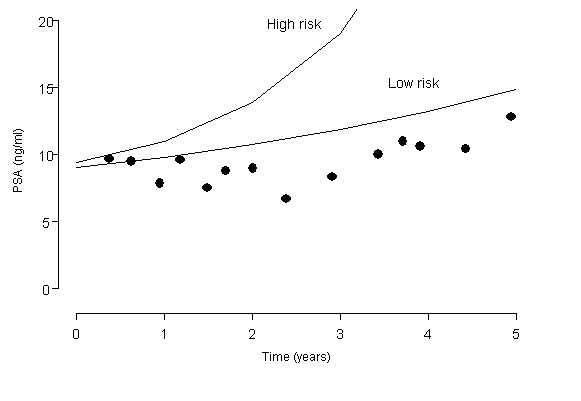
Patient III is a79-year-old man with a baseline Gleason of 7 and a baseline PSA of 9.3 ng/ml. For the 5.5-year period the PSA levels have been slightly rising with a calculated PSA DT of 8.5 years. Because almost all observed points lie below the predicted low risk line, this patient should be considered for a less stringent monitoring schedule.


